It’s become harder to generate qualified opportunities since March of this year. If you’re concerned about the performance of your go-to-market programs, read on. I’m going to describe our experience enabling go-to-market teams to improve new opportunity creation.
Adapting to this new market
During the eight-year bull run in B2B technology, Ideal Customer Profile (ICP) definitions became expansive, stuffed with more aspiration than fact. Messaging lost its edge. And then, in March this year, everything changed—for you and for your buyers.
Soon after March 11, you probably began reassessing your go-to-market efforts.
Scott Albro at TOPO reports 59% of their clients have shifted headcount and budget to stronger segments.
But what about that word stronger. Which buyers exactly are the strong ones?
You may have updated targeting and messaging based on COVID-19 impact assessments and conversations with recent wins.
But if new opportunity creation is still falling short, you’re not reaching enough strong buyers in this new market.
Loose targeting creates waste
Realigning go-to-market programs based on COVID-19 impact assessments and customer conversations is a good first step, but it’s insufficient.
Without factoring in data about your losses, all ICP segments that weren’t damaged by the pandemic will look like equally attractive prospects. But they’re not.
In one case, we found the win rate for a “best fit” buyer segment was 8X better than a marginal segment. Clearly, demand generation and sales development should be reallocated away from that marginal buyer segment, and into the “best fit” buyer segment that converts 8X better.
Defining the strongest buyer segments
Here’s the thing. You’re unlikely to find the strongest segments by doing things the same way you’ve always done.
Identifying the strongest buyer segments requires more precision than the high-level firmographic and technographic segmentation that’s typically seen in an ICP like this:
- Financial Services organizations
- headquartered in North America or Europe, with
- >5000 employees OR >$1B in revenue, and are users of a
- cloud data warehouse like BigQuery or Redshift.
The strongest buyer segments may be hidden within an existing ICP segment. Or a best fit segment may cut across the lines in a segmentation model that uses only firmographic and technographic attributes.
In the example just above, the defining characteristic of the strongest buyer segment was risk appetite. In the lowest win rate opportunities the buyers had a high risk appetite. They had built a containerized web application and were not intimidated by building an application with a new technology. In an account-based model, sales reps working on a large Tier 1 account would use LinkedIn to screen out “high risk appetite” engineering teams. For Tier 2 and Tier 3 accounts, risk appetite signals would be factored into the account scoring model used by demand generation and sales development.
We find these defining characteristics with win/loss buyer interviews. Usually it’s a particular dissatisfaction with the status quo that they all have in common. We call this the buying context: the issue or opportunity to do better that triggered change. Buying contexts vary based on a variety of factors, such as whether the status quo solution was technology-based or services-based; whether the buyer’s technology stack has recently changed or changes are planned; the buyer’s risk appetite; their business model; etc.
Targeting the strongest buyer segments
After completing a baseline set of twenty interviews, we use a three-step process to analyze and act on the data:
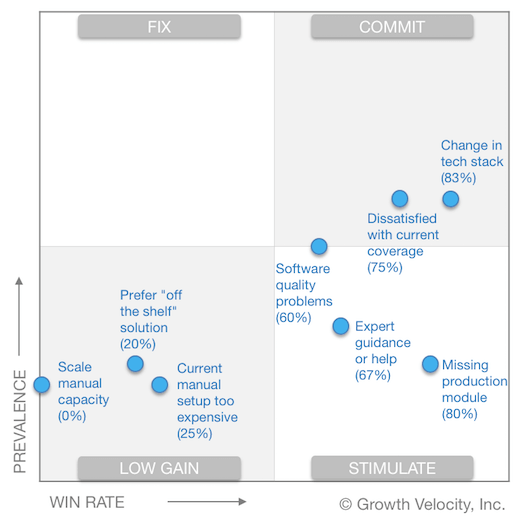
- Categorize each deal by its buying context (the issue or opportunity that triggered the buying interest), prevalence, and win rate. We call this “Value Prop Fit” and use it to identify the best segments to target.
- Profile the best segments: the business justifications that support these buyers’ decisions to advocate for change and the language or lexicon they use to describe it.
- Reallocate: shift demand generation and sales development to the most prevalent, highest win rate buying scenarios. Use insights from the interviews to generate novel targeting approaches and more compelling messaging.
Ultimately, the improvements this methodology produces come from more compelling, differentiated messages that are targeted to buyers you’re more likely to win.
A real-world use case story
At one SaaS vendor we worked with, executives were concerned about a jump in CAC after ramping up Sales Development to generate pipeline. Our Win/Loss Analysis for the CMO revealed that opportunity win rates ranged from 0% to 83% for the five buyer segments represented in recently closed deals. We recommended reallocating go-to-market programs to the three segments with the highest win rates, and eliminating the low win rate segments. Marketing used these insights, and the in-depth buyer profiles we developed, to replace its “loose and intuition-driven” ICP definition and buyer personas and update its messaging framework. The Head of Sales Development told us, “We were running so many plays at the same time and having a tough time defining our focus, so this was huge for us in terms of staying organized and making sure we were doing the right activities on the right accounts.”
Closing the shortfall
In March this year, everything changed—for you and for your buyers. Realigning around the strongest buyer segments in this new market makes go-to-market teams more efficient and more likely to meet your new opportunity targets.












 Follow us on LinkedIn



.svg?v=36ab76060b)