


The OKR framework was first developed in the 1970s by Intel president Andy Grove, when he came up with a goal-setting framework called Management By Objective (MBO). It was made popular by John Doerr, who eventually coined the term/acronym “OKR”.
Objectives and Key Results, or OKRs, are a simple management framework, developed to help every member of your organization see the progress being made towards a common goal.
They're considered “bi-directional”, as it requires a top-down and bottom-up approach. These are strategies that rely on higher authority figures to determine goals that filter down to more junior employees (top-down) or a decision-making process that gives the entire organization a voice in creating company OKRs or goals (bottom-up).
OKRs are usually set across a defined period of time to track progress, maintain progression, and introduce contingency plans when needed.
What do OKRs mean in business?
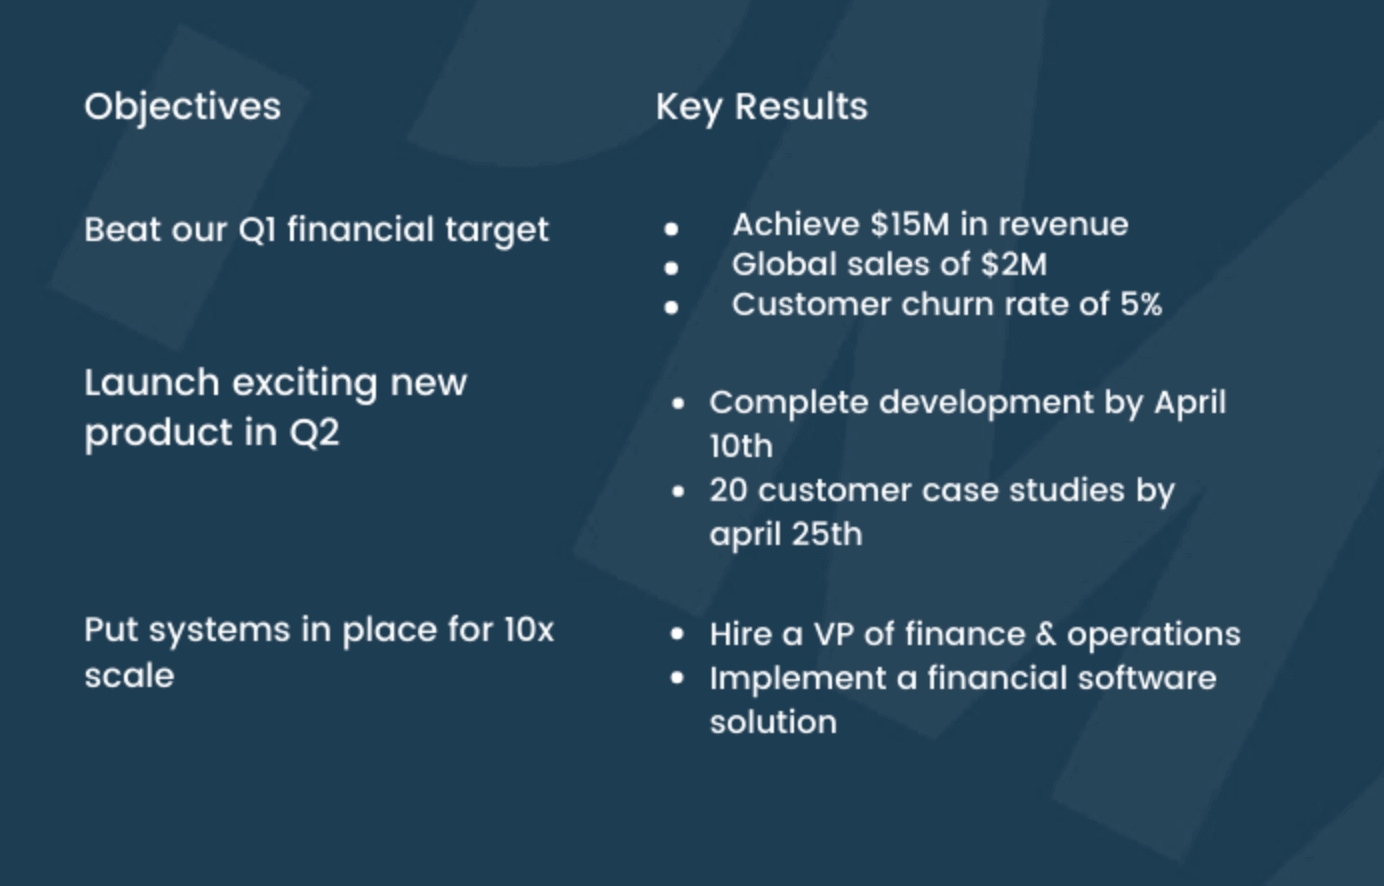
OKRs are defined in two parts: the objective you want to achieve and the way in which you’ll measure achieving your objective - i.e. the key results.
Objectives
Your objectives should be memorable, inspirational, and engaging while motivating and challenging the team.
Within a marketing setting, examples of common objectives including increasing brand awareness, driving more qualified leads, and improving customer retention.
Key results
Key results are a set of metrics used to measure your progress toward achieving your objectives. For each objective you set, you should have a minimum of two results and a maximum of five measurable key results.
Examples of OKRs in marketing
To give you a better idea of what OKRs typically look like in marketing, let's consider a couple of examples:
Objective: Increase Brand Awareness
- Key result 1: Achieve a 30% increase in organic brand searches by the end of the quarter.
- Key result 2: Grow social media followers by 25% across all platforms.
- Key result 3: Increase monthly impressions on owned media by 40%.
- Key result 4: Secure 5 media mentions in relevant industry publications.
Objective: Drive more qualified leads
- Key result 1: Generate 1,000 MQLs (marketing-qualified leads) each month through inbound content.
- Key result 2: Increase conversion rate on landing pages from 8% to 12%.
- Key result 3: Increase gated content downloads by 35% quarter-over-quarter.
- Key result 4: Conduct 3 A/B tests per month on lead forms to improve form completion rates.
Why are OKRs important?
OKRs are incredibly important within marketing. There’s an entire principle dedicated to the importance of setting OKRs in the Product Marketing Manifesto.
There are many reasons why you should be using OKRs within your product marketing strategy. Let's take a look at each in turn:
Bring clarity to your goals
Ideally, an organization should have an overarching objective that everyone within the business should be working towards. Then, individual teams should be setting their objectives in terms of achieving that overall goal.
So establishing strong OKRs for both the organization and your team will give you a clearer vision regarding what you’re aiming to achieve, and ultimately simplify the product marketing process.
Inspire motivation within your team
Giving your team OKRs provides them with a sense of purpose and an actual goal to work towards. This will increase in-house collaboration and overall motivation to achieve success.
Help align purpose and strategy with execution
OKRs help you establish a solid foundation for the product marketing process. With them, you can identify the purpose of your product, the strategies you’ll use to achieve success, and then how they’ll work together to simplify the actual execution of your project.
How do OKRs differ from KPIs?
KPIs and OKRs are commonly confused, and while they’re similar, they certainly aren’t the same. So, we’re gonna lay the facts on the table and explain the difference between the two.
What is a KPI?
A Key Performance Indicator is used to assess performance during a sustained period. This can be applied to the org as a whole, a project, an individual within the team, and so forth.
Given KPIs need to be measurable, quantitative data is favorable when adopting this approach; you could use qualitative KPIs, but subjectivity can over-complicate matters when interpreting data.
OKRs vs KPIs
A significant difference between OKRs and KPIs is the intention surrounding why the goals have been set in the first place.
When companies set KPI goals, they’re considered obtainable and are the product of an existing process or product. On the other hand, OKR goals differ in that they’re A) more ambitious, and B) more aggressive in their execution.
Remember, although OKRs may be bold, they need to be attainable. Although it's not unusual for high targets to be set, you can potentially damage the morale within your team if the final result falls significantly short of the target.
What are good OKRs?
There’s no definitive one-size-fits-all methodology when it comes to OKRs but there are a few principles you can adhere to in order to increase your chances of success.
Objectives are clear
If there’s no way to define your objective how will you achieve it? Or more to the point how will others? Make sure your objectives are as clear as day, take them down to their simplest form so there are no misunderstandings.
Objectives inspire
While your objectives must be simple and easily understandable, they don’t have to be boring.
Set your goalposts high. Often referred to as the “moonshot OKR” or “stretch goal”, this lofty goal inspires the team and helps them think outside of the box to achieve the standards set.
Objectives are public
If everyone’s objectives are known throughout the company each team member can clearly see how their individual goals are aligned with the company’s. Being able to see how their work is a part of the bigger picture can be really motivating.
Measure progress
Track your progress every step of the way, set up a metric to measure your team’s performance, you’ll need it for the next step.
Expect failure
When you shoot for the moon, you’re not always going to reach. But there are some really valuable lessons in failure and if you’ve tracked your objective from the start you’ll be able to pinpoint exactly where you went wrong, or what you didn’t try that could hold the key to your future success.
If you’re not sure where to start with writing your OKRs, take a look at our guide to setting and achieving goals.
How to write effective OKRs in marketing
One of the toughest things about writing OKRs is coming up with the right ones for yourself, your team, and your organization. But once you’ve arrived at a clear objective it will be well worth the investment. As we mentioned previously your OKRs will be hyper-specific to your industry, organization, and team, but below are some good examples spanning various departments to help get you started.
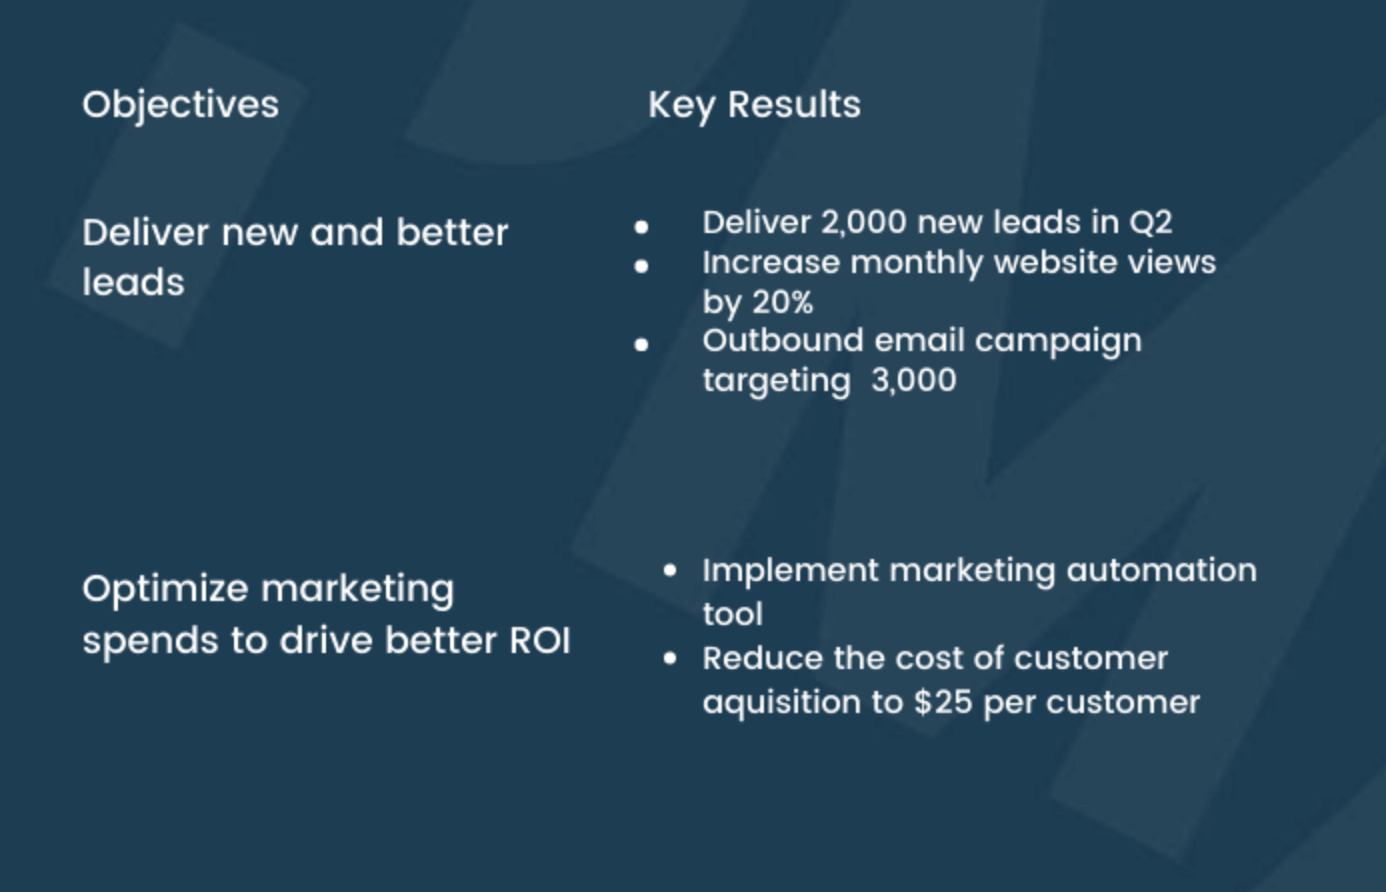
OKRs company example
OKRs marketing example
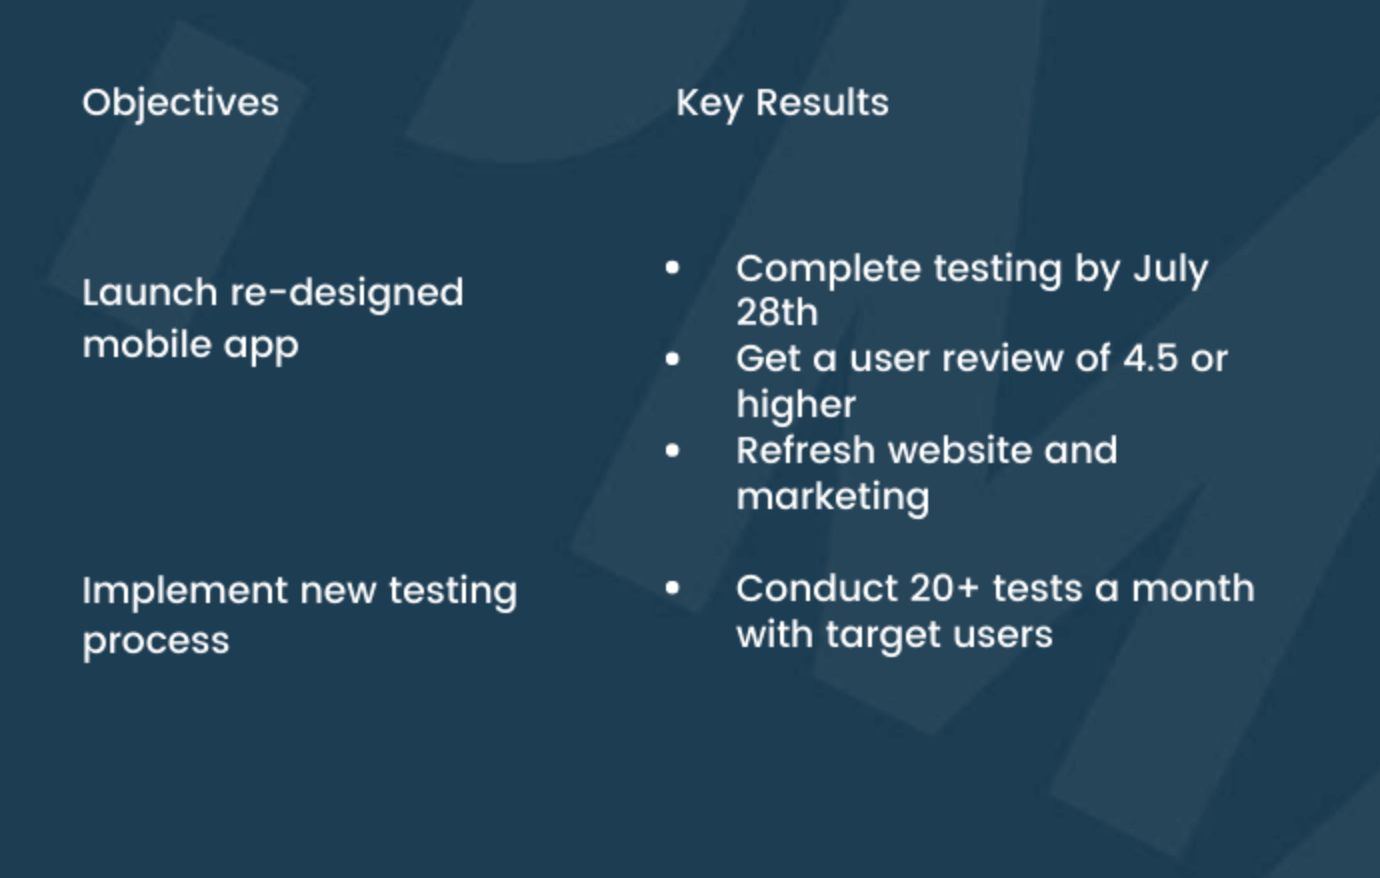
OKRs product example
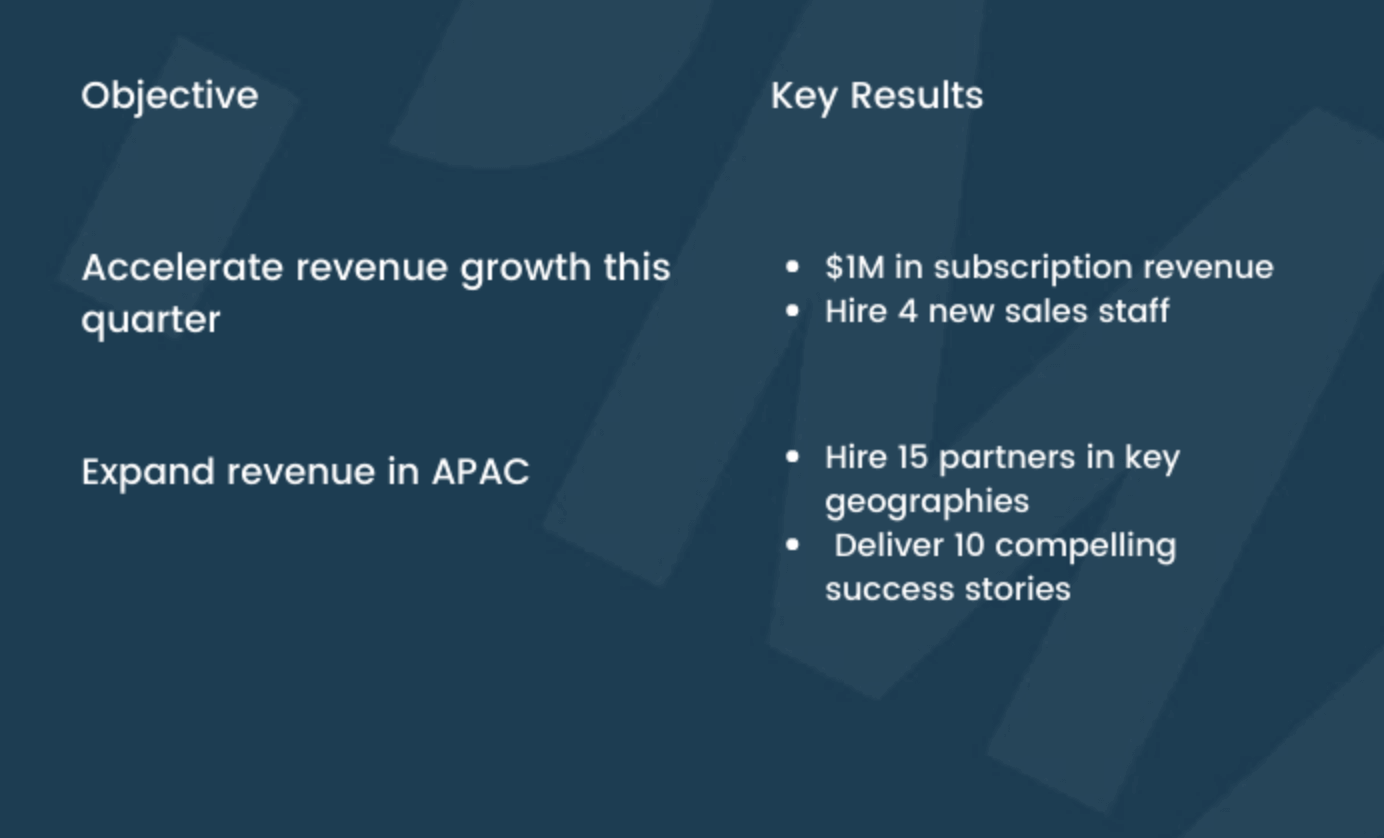
OKRs sales example
What are the benefits of OKRs
Sasi Dharan, Global Marketing Manager at Profit.co, shared his thoughts on why OKRs are so important. He said:
“When you’re starting in the business world you may ask yourself: Why are OKRs and metrics so essential in setting and achieving the most ambitious goals for individuals and teams? And why should you use OKRs?
“Given the success of OKR goal-setting, it’s evident why Adobe, Google, and Netflix all use it. The OKRs model is a great way to measure the goals of any organization.
“In an interview with Harvard Business Review, John Doerr says there are five key OKR benefits. These five benefits are what we call the F.A.C.T.S.acronym.
- Focus
- Alignment
- Commitment
- Tracking
- Stretching
Focus
“Focus is the first and essential benefit of OKRs. When OKRs have been set, it makes you specify the number of focuses. Having more than one objective is quite possible, but it has to be less than seven. It’s better to have fewer objectives than you think.
“Each objective should be on one line. You should not have more than five key results per objective - OKRs force you to make a choice. The OKR cycle should begin with the question: What is the most important thing for the next three, six, or twelve months?
“OKRs are different from other goal-setting systems in that they focus on the few initiatives that’ll make a difference immediately and defer to less important ones.
Alignment
“The real work starts once the top-line goals have been established. Managers and contributors shift from planning OKRs to execution. This linkage is called alignment, and it's invaluable.
“As per Harvard Business Review, organizations with highly-aligned employees are more likely to be the top performers.
Commitment
“Once you have achieved focus and alignment, the commitments are introduced. Commitments are OKRs all parties have agreed to be met, and schedules and resources will adjust to ensure they are.
“Transparency is key to tracking these commitments, and every member of the team must communicate to everyone that they’re working towards their OKRs.
Tracking
“Management by objectives, which tracks OKRs from the output through outcome, is a popular strategy for top-tier organizations.
“Each OKR should be trackable using the metrics that were established at their creation. Though OKRs don't need daily tracking, regular check-ups-mostly weekly-are vital to prevent diminution.
“These reference points will help you grade your OKRs on an individual basis. Is it possible to achieve this goal? Why or why not?
Stretching
“‘Stretching is last, but not least.’ As an organization, you aim for bigger goals, and even if you don't reach the goals that you have set, you might end up achieving close to them. OKRs inherently push organizations to strive further, to squeeze out a bit more than what seems possible.
“F.A.C.T.S is the reason why many companies use the OKR method. Many have found the benefits of focus, alignment commitment, tracking, stretching to be invaluable.”
What are product marketing OKRs?
Here are some examples of common product marketing goals we hear being used regularly and broadly speaking, they can be split into four pillars:
Go-to-Market OKRs
- Win rates
- Reason for winning
- Market share
- Conversion rate in target segment
- Average deal size
- Product-market fit
Sales enablement OKRs
- Asset utilization
- Sales confidence
- Deal velocity
- Time to close
Lead demand/gen OKRS
- Campaign performance
- Leads influenced by PMM content
- Brand awareness
Product adoption OKRs
- Active users
- User satisfaction
- Retention
- Feature adoption
- Up and cross-sell revenue
- Time taken to complete actions
To delve into each of these in granular detail, download our Intro to OKRs eBook >
It’s important to set a predetermined time frame in place. If you start off measuring a certain metric once a quarter to once a month to once a week, you’ll struggle to form any kind of trend.
So, let’s take a look at those goals a little closer.
What are go-to-market OKRs?
Win rates
The formula for calculating your win rate is:
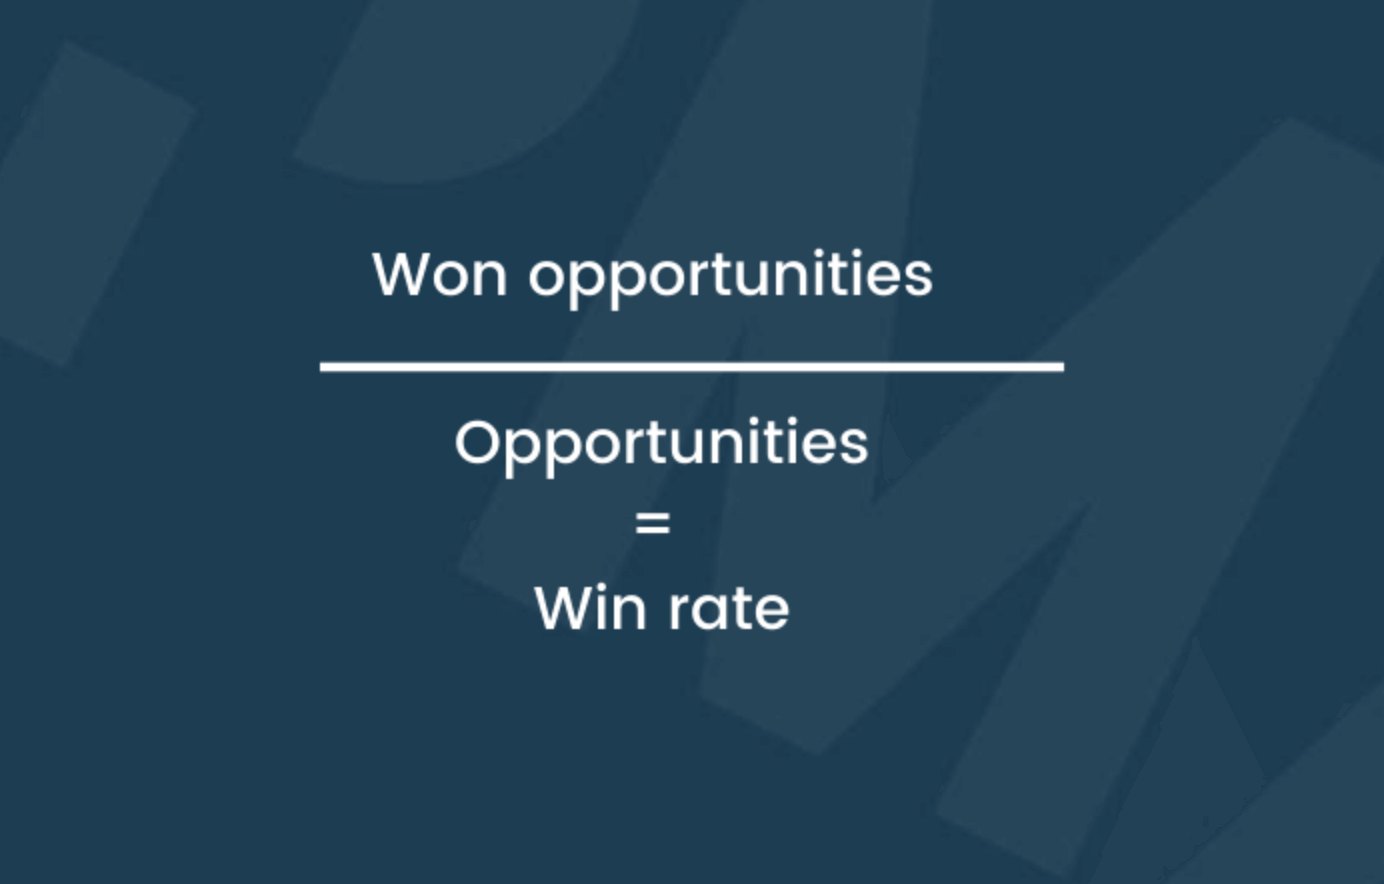
If you won 56 deals last month out of a total of 317 opportunities, your win rate would be 18%.
An improvement in win rates demonstrates that you’ve put your sales teams on the right track. As well as tracking overall win rates, you should also look to track win rates for specific personas, industries, and market segments.
Market share
It’s a given that you’d want to own as much of your market as you can. If you were in the software security business and you currently own 20% of that market, why wouldn’t you want to own more? You’d want to dominate it right? Let’s look at how you work that out:
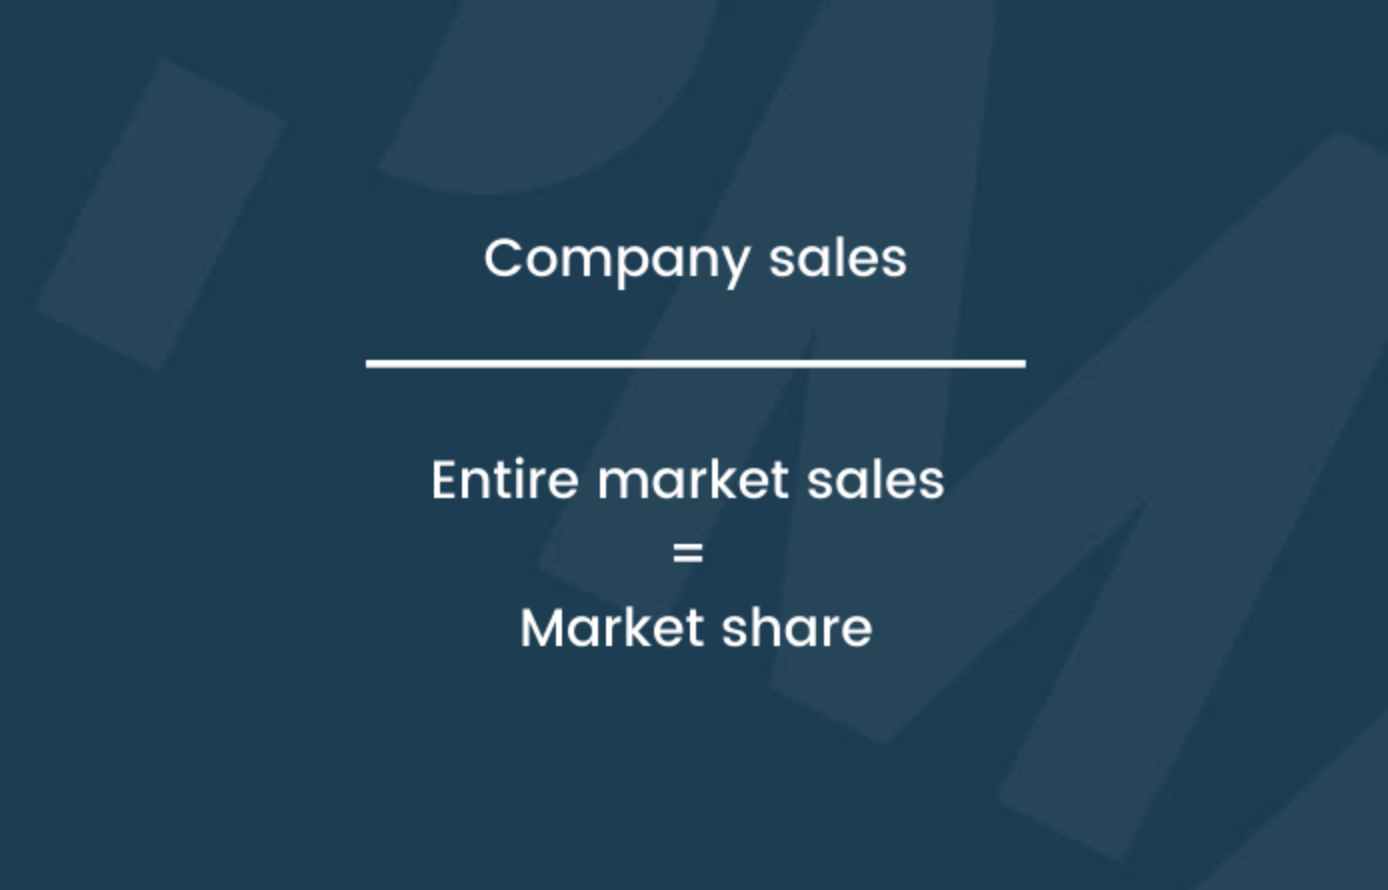
If your business has sales of $10 million and the entire market is $200 million, your market share would be 5%. To find out the entire market’s sales check out sources like trade groups, regulatory bodies, or analyst surveys, or conduct your own research.
The conversion rate in the target segment
If your positioning, messaging, segmentation work, battlecards, or content mapping is contributing to how you target certain markets and personas, it will be impacting how successful marketing and sales are in their roles and you should be rewarded for that.
To demonstrate and translate your contribution remember to collect conversion rate stats before you step in and then compare that number to the conversion rates the business sees after product marketing has stepped in.
To remove any ambiguity, consider attaching a timeline to your findings, for example:
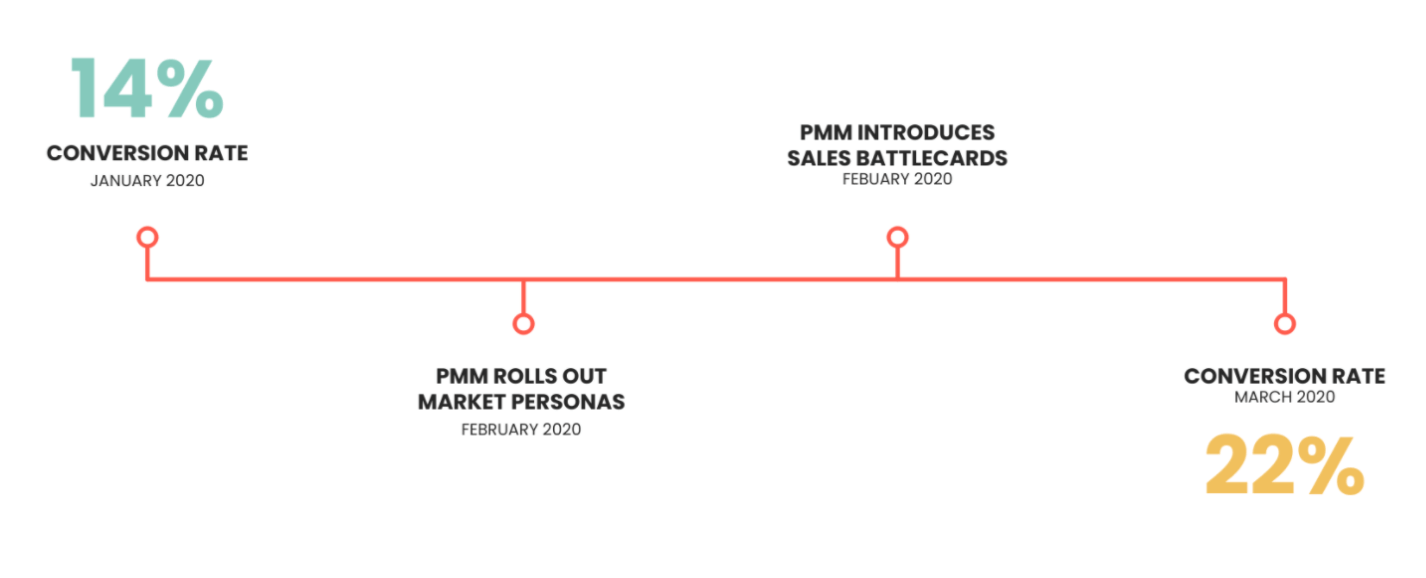
Providing there were no other significant variables around that time frame, that’s a pretty compelling case that what you’re doing is having a tangible and monetary effect.
Product-market fit
Product-market fit is a key metric to measure, without it, any business - whatever industry you’re in, the market you serve, or customer you target, is set for failure or at the very least, a tricky path to success.
Below is a pretty-well-known passage within the product marketing industry by Marc Andreessen - an American entrepreneur, investor, and software engineer, regarding, knowing when you have and haven’t reached product-market fit.
“You can always feel when product/market fit is not happening. The customers aren't quite getting value out of the product, word of mouth isn't spreading, usage isn't growing that fast, press reviews are kind of ‘blah,’ the sales cycle takes too long, and lots of deals never close.
“And you can always feel product/market fit when it is happening. The customers are buying the product just as fast as you can make it — or usage is growing just as fast as you can add more servers. Money from customers is piling up in your company checking account. You're hiring sales and customer support staff as fast as you can. Reporters are calling because they've heard about your hot new thing and they want to talk to you about it. You start getting entrepreneur of the year awards from Harvard Business School. Investment bankers are staking out your house.”
So, that defines either end of the spectrum, but how do you go about measuring the stages in between? One tactic is to ask early adopters “How would you feel if you could no longer use the product?” and measure their responses on a scale of very disappointed, somewhat disappointed to not disappointed at all. If less than 40% of your customers say “very disappointed” you’re more likely to struggle to find growth.
To add substance to this first question consider adding other questions too, like:
● Where do you get the most value out of our product?
● What could we do to improve our product?
● What areas don’t you see benefits in?
● Are there any problems our solution isn’t solving?
This is a metric that can then be monitored, monthly or quarterly, and aligned to product milestones.
Sales enablement OKRs
Asset utilization
Asset utilization includes battlecards, sales one-pagers, case studies, product demo videos, etc. This kind of content can make or break deals and if you’re creating it, it’s only fair that your contribution is taken into account.
You could measure its effectiveness by tracking how many sales reps use certain assets each week, month, or quarter. You could then marry up those content usage stats with their use case and the outcome.
If, for example, a sales one-pager is used during first-line sales calls, you could track the percentage increase in the number of those first calls that translate into second or third calls.
Or, if a case study’s used by marketing as part of an email nurture campaign, you could monitor the impact the case study has in terms of moving prospects further down the funnel.
As well as using apps that allow you to see how many times a certain piece of content has been viewed, you can ask relevant teams and departments:
● Which assets help you the most?
● How many times have the assets made a prospect consider us more favorably against a competitor?
● How can we improve these assets?
● Which three areas do you need the most help with?
Sales confidence
Confident sales reps make better pitches and better pitches close more deals. It’s as simple as that. In terms of measuring sales confidence, a quarterly or six-monthly survey should do it - we wouldn’t recommend more often than quarterly as you’ll struggle to see meaningful differences that soon.
Time to close
Time to close measures how long it takes to convert a prospect into a customer. The less time and touchpoints your sales team spends persuading a prospect to choose your product, the more time they have to warm up other leads and bring in more sales, which opens up more revenue opportunities.
In terms of tracking this one, if you have a CRM system in place it should be pretty simple. You need to be able to identify when a prospect enters the funnel - whether that’s through a guide download, webinar tune-in, or cold call, and what date they closed.
Lead/demand-gen OKRs
Campaign performance
Campaigns refer to anything from a cross or up-sell email to an in-app notification nudging users to a new or unused area of your app.
There are several different metrics within this and the type you choose will depend specifically on the type of campaign you’re going out with, but, for example, if you’re sending an in-app notification to encourage existing users to take notice of an existing feature, your KPI could be around how many of the people who see the notification actually click on it and visit the area of your app you were directing them to.
Brand awareness
Brand awareness is often benchmarked against things like social media followers and press coverage but in many ways, these are vanity metrics and aren’t all that relevant in the product marketing world.
Switching your focus to a brand personality assessment survey will help you keep a pulse on how prospects and customers perceive you, which, when you look at the bigger picture, can help position you well from the lens of investors and analysts.
Here are a few pretty standard questions you could ask:
● When you think of our product/brand, what words come to mind?
● Of the words you said, how do you feel about each?
● How innovative would you say we are (a scale from very innovative down to not at all innovative)?
● How unique would you say we are?
● How would you describe your last experience with us?
Product adoption OKRs
Active users
In terms of documenting active users as an OKR, it could be something as simple as a rolling percentage in terms of how many users you have versus how many active users you have, like this:
User satisfaction
User satisfaction could relate to
● The customer’s onboarding experience
● Your product’s usability
● Overall satisfaction
● Speed
● Functionality, and more.
Let’s take onboarding as an example. If you’re responsible for your product’s in-app tour, help section, and emails, you could set up routine calls with customers who were recently onboarded and pick their brains about how they found the experience.
● Did you feel like our onboarding process covered everything you needed?
● Were you able to use our product with ease after you finished the onboarding?
● How could our onboarding process be better?
To put a more quantitative metric on it and help you understand what direction you’re heading in, you could also throw in an “On a scale of one to 10, how would you rate our onboarding process?” and use the results as your OKR barometer.
Feature adoption
If you already have a product on the shelf and you’re adding a new feature to it, you could measure the adoption of that specific feature.
As well as tracking campaign performance metrics like open and click-through rates, you could measure your success based on how many people start using that feature after the campaign versus how many people were using it before the campaign.
Time is taken to complete an action
Last but not least is the time taken to complete certain actions within your app. This will vary depending on your product but it could be, for example, how long it takes a user to set up a social media advert.
When you’re setting OKRs for the time taken to complete an action, as well as monitoring and comparing the time taken before and after your education campaign, remember to keep an eye on the time it takes new users to complete the task too, and if any trends are emerging, consider including your education piece as part of the onboarding process.
Now that we've covered all the of OKRs available to you, here's a companion toolkit to help you start implementing them.
Essential product marketing OKRs and metrics
We have compiled a list of what we consider the most essential product marketing OKRs and metrics within product marketing that’ll boost your projects, help to prevent customer churn, and increase sales.
Remember, there isn’t a blanket approach that can be applied to the world of OKRs and metrics; you need to choose metrics to suit your sellers.
Leads
Click-through rates: This is the ratio between the number of clicks on a specific Call-to-Action (CTA) and the number of times people were exposed to the link. Click-through rates are important because they help you understand what works with your product when it comes to reaching your target audience.
Cost per Lead (CPL): This metric measures how cost-effective your product marketing campaigns are in terms of producing new leads (people interested in your product) for your sales team. Calculating the CPL helps to establish a solid budget to spend on acquiring new customers. This’ll then, in turn, help improve the rate at which you gain new customers.
Revenue
ARR/MRR: These stand for Annual Recurring Revenue and Monthly Recurring Revenue, respectively. They measure the recurring amount of money your company expects on a yearly (ARR) or monthly (MRR) basis. These metrics are perfect for when you have a subscription-based product and provide an insight into the efficiency of your business and product marketing techniques.
ARPU/ARPA: Average Revenue Per User or Average Revenue Per Account helps you to measure your company’s revenue based on how many users or accounts you have. They’re often used synonymously, but sometimes this isn’t helpful, as one person could have multiple accounts. Either way, these metrics are important in helping you identify profitability, and which of your products generates the most revenue.
Win rate: This measures the number of successful sales that your organization has throughout its sales cycle. This is, of course, extremely important in identifying areas of improvement with your product, understanding your current finances, and also helping to predict future sales.
Bailey Haslam, Marketing Director at Clozd, wrote an interesting article on how win-loss analysis can be used to improve company performance and revenue.
 Bailey Haslam
Conversion
Conversion rates: This is calculated through the number of conversions -or the number of times your CTA’s responded to - divided by the total number of visitors. Conversion rates are important to measure because this metric highlights how many prospects you’re successfully turning to fully-fledged customers.
You get to see who’s genuinely interested in your product, and how many go through with the sale vs how many don’t. You can improve this rate through a process called conversion rate optimization (CRO).
Cost per acquisition (CPA): This financial metric measures how much it takes for a business to acquire a single customer. CPA’s essential if you’re running an online business because it determines your return on investment (ROI) and creates a direct link between revenue and how your product marketing campaigns impact it.
Engagement
Churn/retention rates: Churn and retention rates are arguably the most popular metrics to measure within product marketing. They refer to the rate at which a customer either discontinues (churn) or continues (retention) business with you. These are incredibly important for your business to know because lost customers mean lost revenue/sales.
A churn rate will tell you that you need to identify why customers are leaving, and try to fix it. Conversely, in the case of a retention rate, you’d need to find what’s so good about your product/business that’s prompting customers to remain loyal to your brand.
Charley Gale
Time on Page: This metric measures the amount of time a customer spends on pages within your website. You can analyze how interested your customer is in your content by comparing how long they’re on the page, with how long it would on average take to actually read the information.
Traffic
Traffic sources: This helps to track where your traffic’s coming from. For example, via organic search, direct links, social media, etc. Measuring where the visits are occurring most helps you to optimize an effective strategy to continue improving your traffic rates.
Bounce rate: This metric measures how quickly visitors leave your website after arriving. Though it won’t tell you why they’re leaving so quickly, it’ll give you a better indication of what’s working with how you market your product.
Integrations such as online heat maps can be integrated into your website to give you an impression of how people are using your site.
How to optimize your use of OKRs and metrics
So how do you know if you’re achieving your OKRs or if you’re using metrics effectively?
We have a checklist that’ll help you to ensure you’re using both methods as you possibly can.
- Identify the methods you’re already using. This’ll help you see which areas you’re lacking in, and motivate you to find ones to compensate.
- Find a metric - or OKR- that’ll fill in the gap you’ve found. By doing this, you’re ensuring that you’re covering as many bases as you can, which gives you a greater chance of discovering many potential areas that need improvement.
- Continually and consistently track and review them. It’s okay to put these metrics in place, but you need to truly analyze the data you’re receiving from them consistently to continue improving your product. The same goes for your OKRs. Are you on track to meeting your goals?
- Include your team in the process. Collaboration on the data side of your project will ensure its importance is spread throughout your company, and adopt it into the standard procedure for your organization.
Mary Sheehan, Head of University Student, SMB, and Acrobat Campaign Marketing - Engagement & Retention at Adobe summarised her top five steps to the best metrics approach:
“One, know your stakeholders - get inside their head. Think of the goals that they really care about, and make sure that those align with what they're thinking. Two, choose those top-level goals wisely, put them through your framework and think ‘does this actually make sense for our business? Are these motivational things that we can have?’
“Three, align yourself to the metrics that you can own and drive so you have the power. Four, know the right tools - so explore tools and budget with your counterparts as soon as you can. And finally, build the measurement plan and don't forget to report on it monthly, to come back to it, and to iterate on it if you need it.”
Challenges with using OKRs and how to overcome them
Here are a few common mistakes that people make, or challenges they face when using OKRs and metrics to measure their product performance.
Difficult to measure PMM success
According to last year’s State of Product Marketing report, 15% of participants said they didn’t currently have any OKRs in place. This could be due to the fact that, with the product marketing profession, it’s difficult to attribute efforts to specific performance and success metrics.
It’s hard to pinpoint product marketing’s contribution to revenue and the bottom line. However, using OKRs and metrics is incredibly helpful in allowing you to identify what you perhaps need to improve. For example, they can help to:
- Generate new revenue.
- Increase marketing qualified leads.
- Increase win rate.
- Improve customer retention.
- Up-sell customers.
- Improve sales confidence.
- Increase sales qualified leads.
- Increase website traffic, and so on.
In response to this 15% result, Daria Gogoleva, Marketing Lead at Insense, a Facebook & TikTok Partner said:
“It is a big struggle for my company, too. We tried to implement KPIs several times but many attempts ended in failure. It’s difficult as the product marketer’s role is so cross-functional. However, I believe that KPIs are urgently needed for everyone who cares about the effectiveness of their work. Many companies have a North Star to which everyone in a team contributes indirectly.
“But if we talk about direct KPIs, it might depend on the project. For example, if we need to launch a new product page, and our goal is to increase the conversion rate of that page, first, it’s an ongoing project that requires testing hypotheses. Second, the conversion rate might depend on so many things: a copy, design, lead magnets, and even the quality of the traffic. Different people work on these different things and share a project KPI, including a product marketer.”
Focusing on vanity metrics
Vanity metrics are numbers that don’t measure your performance in a way that’ll help future product success. Instead, they’re metrics that just make you look good.
For example, social media metrics- such as post likes and comments- are handy for making your brand look popular, and can be useful due to increased engagement and outreach.
But, if they’re not accumulating in actual sales and customers, they don’t mean much for your business. So, don’t focus solely on these metrics. Combine them with other, particularly important ones that’ll help understand the actual performance of your product (like the ones we’ve listed above!)
Expecting immediate results
Analyzing OKRs and metrics takes time. They’re things that you’ll need to be using consistently to see benefits within your business and may take months to see improvements. Be patient. Stick with it. Thank us later.
Creating too many OKRs or metrics
Overusing these methods is incredibly time-consuming. OKRs should only be used for top-priority targets - not as your to-do list. Ensure that you’re focusing on only the most important and beneficial metrics and OKRs to build a solid foundation for identifying the best product marketing process for your company.
Setting unrealistic targets
It’s so easy to get lost in the excitement of what you’d like to achieve. And sometimes the objectives that you end up aiming for are unrealistic when compared to your company size, budget, or workload. Ensure that you’re consistently checking how practical your OKRs are, and setting yourself time frames of when you’d like to be seeing these achievable targets come into fruition.
Getting started
We’ve popped together an all-encompassing eBook on all things OKRs, so you can get off to a flying start.
 Product Marketing Alliance
Needing to measure your product marketing success is a huge part of the role. After all, how are you going to identify what works and what doesn’t without metrics and data to back it up?
Our Metrics Certified: Masters course will give you the knowledge and confidence you need to measure the impact of your work and continue driving, not just your product and department, but the entire company towards success.
By the end of this course, you’ll be able to:
🎆 Use formulas to correctly measure key metrics.
💪 Identify which metrics you should track for each deliverable.
👀 Understand how your work can positively influence these metrics.
🔦 Relate your KPIs to your OKRs and confidently report on the impact your function has on the business.
Ready to get started?


Product marketing insider
Thank you for subscribing
Level up your product marketing career & network with product marketing experts.
An email has been successfully sent to confirm your subscription.
 Follow us on LinkedIn


.svg)
Start the conversation
Become a member of Product Marketing Alliance to start commenting.
Sign up now