As product marketers, we're constantly striving to prove our value and drive tangible results.
But in a world of endless data points, how can you effectively measure your impact and steer your strategies in the right direction?
Enter product marketing metrics – they provide invaluable insights into the success of your initiatives and empower you to make informed decisions, justify your strategies, and maximize your impact on key business outcomes such as revenue growth, customer acquisition, and market share.
The question then becomes: how can you measure the success of your product marketing without the right metrics? It would be a tall order.
This article looks at the metrics product marketers are tracking and discusses:
- Essential metrics PMMs should be tracking
- The four key categories of product marketing measurement
- Pre vs post-product-market fit metrics
- KPIs vs. OKRs vs. metrics
- The 10 key types of metrics you should be tracking
- Lagging vs leading indicators in product marketing
- Multi-touch attribution for product marketing
What metrics and KPIs should product marketing track?
Measuring the true impact of product marketing demands a multidimensional view of how users discover, engage with, and remain loyal to your product.
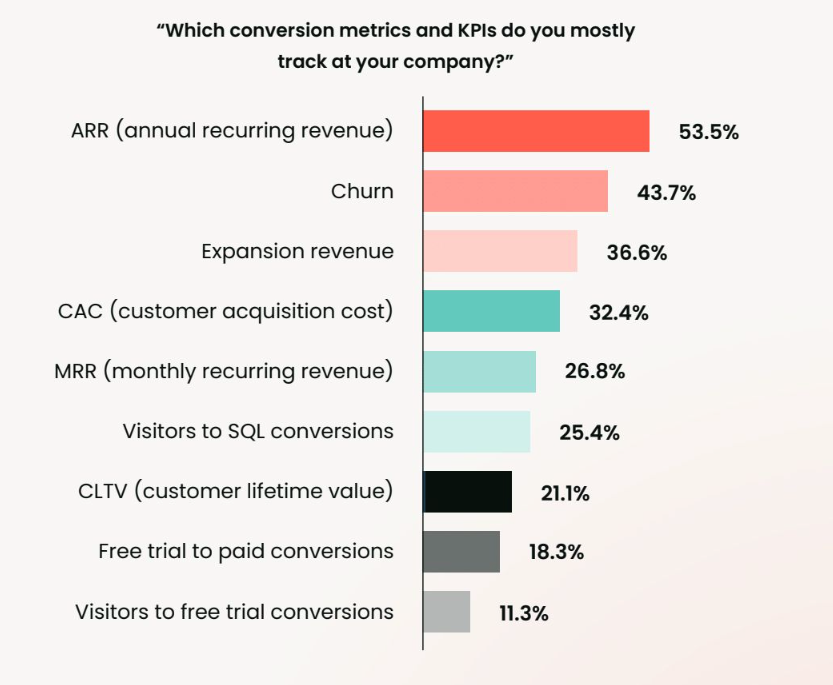
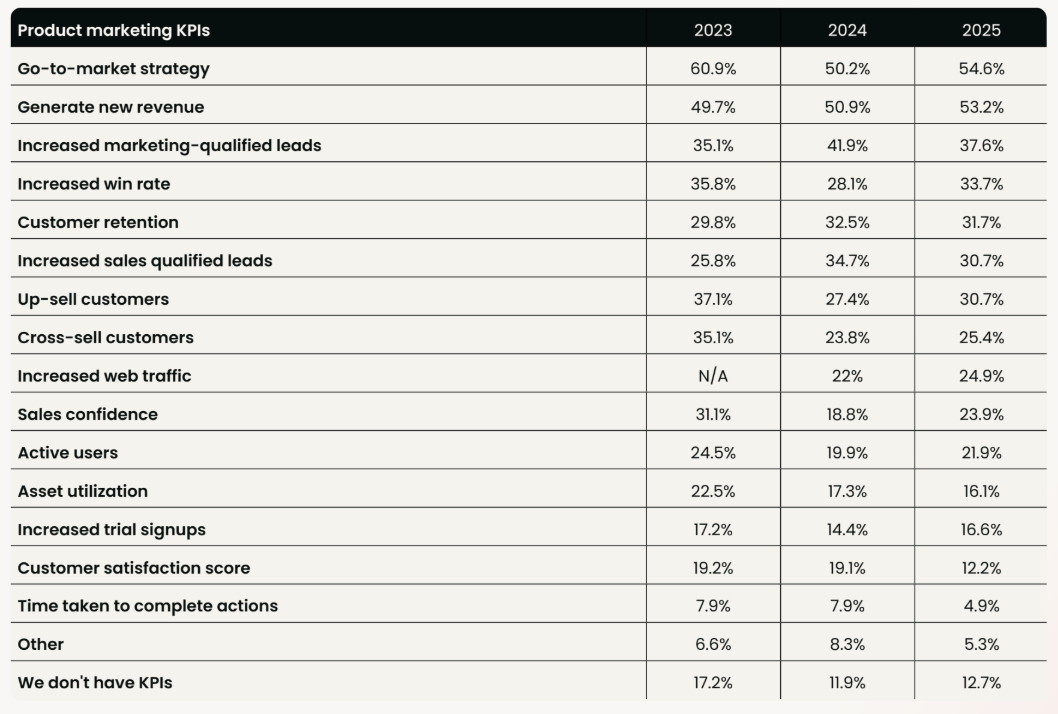
Customer acquisition and revenue-focused metrics like ARR, MRR, CAC, and CLTV provide a foundational understanding of growth. This helps PMMs tie their work directly to business outcomes. These numbers are especially valuable for financial forecasting and strategy alignment, with revenue generation emerging as one of the most commonly tracked metrics among product marketers.
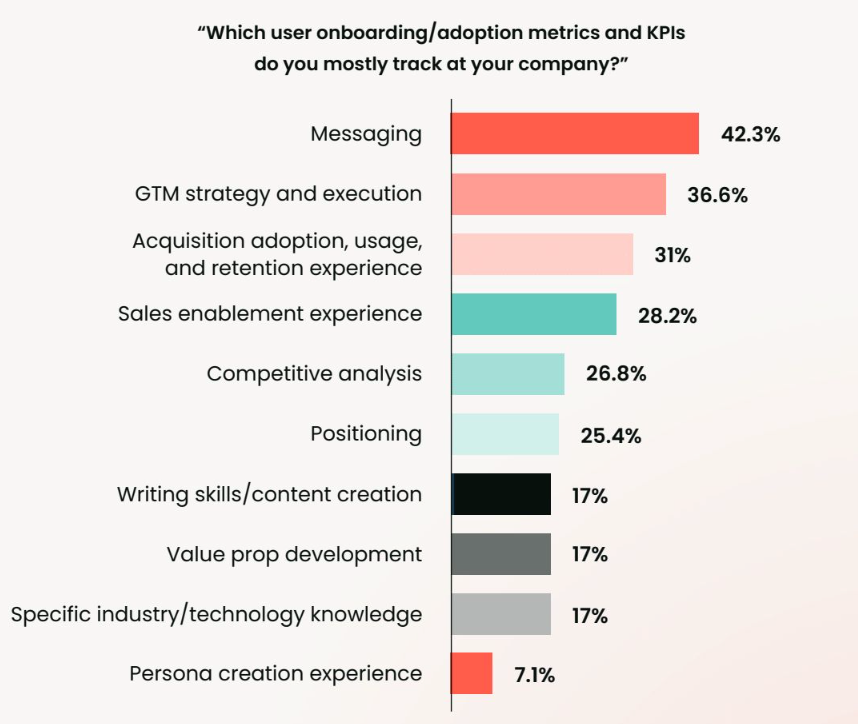
Equally important is how effectively product marketing shapes the user journey. Metrics tied to messaging clarity, go-to-market execution, positioning, and sales enablement offer critical insights into how well your efforts are resonating. (More on that below).
Messaging effectiveness, for example, is one of the most widely tracked engagement indicators, underscoring the need for clarity and consistency across every customer touchpoint. This extends to product-specific performance as well, where tracking adoption rates, usage frequency, and upsell success helps fine-tune how value is delivered and communicated.
User behavior and satisfaction data give product marketers the feedback loop they need to iterate effectively. Tracking metrics like DAU/WAU/MAU, session length, and NPS reveals how deeply users are engaging with the product, while retention indicators such as churn, renewal, and CSAT help diagnose the quality of post-sale experiences. These signals offer a vital lens into how well product value is being delivered over time, and whether users are sticking around because of it.
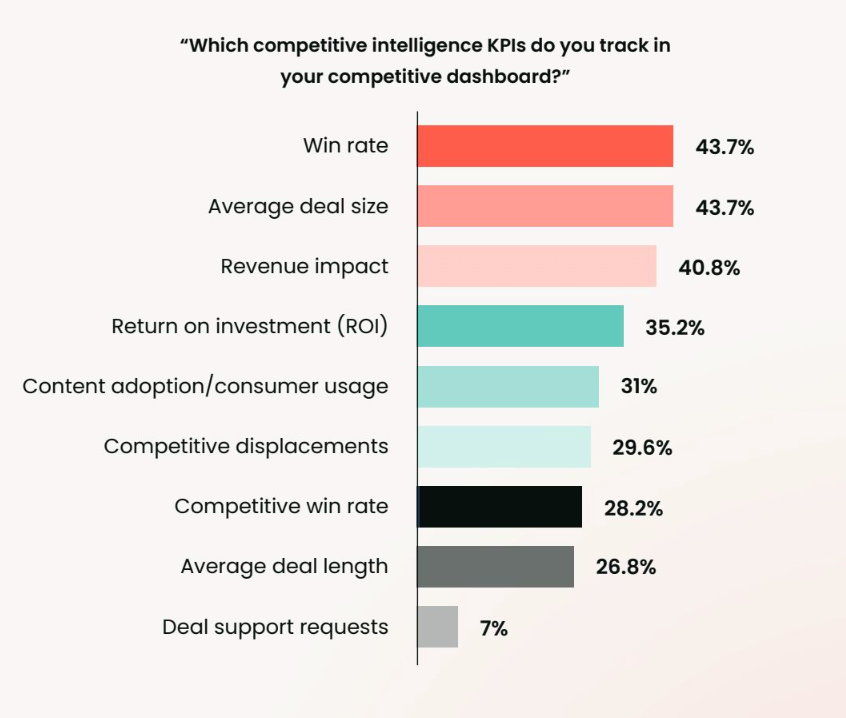
Finally, to stay competitive and improve go-to-market execution, product marketers must monitor market-facing indicators. Win/loss ratios, deal size, and competitive displacements provide a view into your market position, while campaign-specific metrics like ROI, CPL, and MQL-to-SQL conversion rates highlight what’s working (and what’s not) across demand gen.
Taken together, these metrics provide the insights needed to elevate product marketing and showcase its value to the business.
Four key categories of product marketing metrics
At a high level, product marketing’s main areas of focus include go-to-market initiatives, sales enablement, marketing support, and product adoption. We’ll look at each of these in detail, as well as a few metrics that can help point to product marketing’s effectiveness.
Go-to-market metrics
A strong go-to-market (GTM) strategy starts with clear, compelling messaging that links your product to the right audience. Product marketers play a key role here, shaping positioning based on deep persona research, product knowledge, and competitive insight.
But how do you know if it’s working?
- Win rates: When win rates improve after a repositioning or product launch, it’s often a sign that your messaging is hitting the mark. Sales doesn’t close deals alone. Product marketing lays the groundwork by helping prospects understand the value from day one.
- Conversion rates: If product marketing supports demand gen (as it should), conversion rates offer a direct view into messaging effectiveness. Targeting the right segments and tailoring your positioning accordingly can significantly lift performance across the funnel.
- Analyst reports: For teams managing analyst relations, these reports offer powerful third-party validation. A strong showing in analyst evaluations signals that your positioning stands out, and helps buyers see it too. While risky for early-stage startups, participating can surface invaluable feedback and, if successful, generate meaningful demand.
Sales enablement metrics
Product marketing doesn’t just shape messaging. It also equips sales and customer success teams to confidently engage prospects and customers. When sales enablement is working, it shows up in how deals progress and close. Here are three key metrics to watch:
- Asset utilization: Are sales teams actually using the materials you create? Tracking usage of playbooks, battlecards, and other resources (via Google Drive, SharePoint, etc.) gives insight into their relevance. High usage signals your content is resonating; low usage may highlight gaps in timing, format, or targeting.
- Deal cycles: Shorter sales cycles can be a direct outcome of effective enablement. If reps are equipped with the right content at each stage of the funnel, they can move deals forward faster and with fewer obstacles, especially when assets are tailored to key decision-makers or common objections.
- Win/Loss ratio: The purpose of enablement isn't to increase the number of leads you get. It's instead intended to improve what sales does with them. A rising win rate indicates your materials are helping reps close more of the opportunities they’re given. It’s not about volume; it’s about impact.

Marketing support metrics
Product marketing is the engine behind messaging that powers demand gen, content, brand campaigns, and product launches. While the specifics vary by company size, a few core metrics consistently reflect how well product marketing is enabling the wider marketing team:
- Campaign performance: If your messaging is resonating, you’ll see it in campaign results. Are email, social, and paid ads performing better with new messaging frameworks? A/B testing old vs. new content is one of the clearest ways to measure product-market fit. Sophisticated tools like ESPs can also reveal which messages, offers, and CTAs drive the most engagement—critical data for refining your strategy.
- Website traffic: While traffic growth is a team effort, product marketing lays the groundwork. Messaging around product benefits, brand positioning, and updates influences how people find and respond to your site. Increases in impressions, click-throughs, and visits often reflect stronger awareness and better alignment between what you’re saying and what buyers want.
- MQLs and SQLs: Are your messages attracting the right people? Spikes in Marketing Qualified Leads (MQLs) and Sales Qualified Leads (SQLs) suggest that your positioning is compelling and reaching the right audience. SQLs are especially telling—they show that interest is turning into serious consideration, not just surface-level clicks.
Product adoption metrics
Perhaps the most direct indicator of strong product marketing output is product adoption. If PMM’s high-level responsibility is to translate product features into customer value points, measuring the onboarding and usage rates of your products is a critical litmus test for any product marketer.
- Onboarding data: How engaged are new customers in their first 90 days? Are they activating key features and seeing value early? If not, product marketing may need to revisit onboarding content and help materials. A strong start reflects how well you’ve communicated the product’s value to those who’ve already bought in.
- Feature adoption: When you launch a new feature or upsell offer, how quickly do users engage? High beta sign-ups and increased renewal values suggest your messaging is resonating. If adoption lags, it could be a sign that your narrative around the feature isn't landing.
- Churn rates: Customers don’t just churn because of poor product experiences. They also churn when competitors tell a better story. If messaging doesn’t build trust and reinforce value, customers may start looking elsewhere. Rising churn is often a sign that your product marketing isn’t keeping pace with market expectations.
Get the full story
Do you want to learn what exactly your competitors are tracking and why? All the numbers and the stats (which you can use to make those all-important decisions)?
Then download the Product Marketing Metrics eBook (for free) and harness the power of data to improve your marketing.
Don’t get left behind – start tracking the right metrics for success.
Pre vs post product-market fit metrics
Understanding the business impact of product marketing requires recognizing that its influence often unfolds over time, and varies depending on a company’s growth stage. As Kirti Sharma of Sprinklr explains, the focus of a PMM can look very different pre- and post-product-market fit.
Pre-product-market fit metrics
In the early days, when positioning is still being refined and GTM motions are taking shape, sales effectiveness becomes a key indicator. Measuring how often sales reps use PMM-created assets like battlecards and pitch decks reveals how embedded your work is in the sales process.
More qualitatively, direct feedback from the sales team (what helped, what didn’t, and where they need more support) offers rich insight into how product marketing is influencing pipeline progression.
Alongside asset usage, early-stage PMMs should keep a close eye on win rates within their target market. A rising win rate, particularly against key competitors, signals that your GTM strategy and positioning are taking root. But win rates alone don’t tell the full story. To truly understand the impact, it’s important to look at why deals are being won.
Post-product-market fit metrics
Once product-market fit is achieved and the company scales, the PMM remit broadens. Brand awareness becomes a more strategic priority, and PMMs should be leveraging tools like brand perception surveys to offer deeper insights into how the market perceives the company, and whether it aligns with their desired attributes (e.g., innovative, trustworthy).
This is also the stage where analyst relations come into play. Strong relationships with respected firms, even niche ones, can reinforce your brand position and influence buyer perceptions in meaningful ways.
Finally, mature PMM teams typically focus more intentionally on product adoption and inbound conversion performance. Whether through in-app messaging, newsletters, or customer education, PMMs have the ability to drive stronger usage, deeper engagement, and ultimately, better retention and upsell outcomes.
Meanwhile, analyzing conversion rates from inbound sources (especially how those leads perform over time in terms of deal size and LTV) offers one of the clearest long-term indicators of marketing effectiveness.
KPIs vs. OKRs vs. metrics
What are the differences between KPIs, OKRs, and metrics?
- Metrics: Foundational measurements tracking various aspects of product and marketing performance.
- KPIs (key performance indicators): A subset of metrics critical to evaluating success in achieving specific business objectives, typically long-term and ongoing.
- OKRs (objectives and key results): A goal-setting framework combining ambitious objectives with specific, measurable key results, usually set for shorter periods (often quarterly).
10 key metrics every PMM should be tracking
1. Win rates
A win rate shows how many sales your team has “won” or successfully closed. To calculate this, you divide the total number of closed (or won) deals by the total number of deal-stage prospects you had, whether they were won deals or not.
Win rate = Won deals / All deal stage prospects
2. Conversion rates
A conversion rate shows the number of visitors on a site that carried out the desired goal (i.e. paid for a product).
To calculate this, you divide the number of conversions by the total number of visitors.
Conversion rate = Number of conversions / Total number of visitors
3. Asset utilization
Asset utilization is a ratio that indicates how well a company uses any given asset to make a profit.
To calculate this, you add the total assets at the beginning of the period with the total assets at the end of the period and then divide this sum by two.
Asset utilization = (Total assets at the beginning of the period + total assets at the end of the period) / 2
4. Deal cycle
A deal cycle is the average number of days or months it takes to close a deal.
To calculate this, you add up the total number of days it took to close every deal, and then divide this number by the total number of deals.
Average deal cycle = total number of days it took to close every single deal / total number of deals
5. Win/Loss ratio
A win-loss ratio is used to compare how many deals are being won or lost.
To calculate this, you divide the number of won deals by the number of lost deals.
Win/loss ratio = number of won deals / number of lost deals
6. Site traffic
Site traffic, as it says on the tin, shows you the number of visitors that are being driven to your website. There are plenty of metrics you can use to see whether people are engaged with your content (engagement rate, bounce rate, click rate, etc.).
7. MQLs and SQLs
An MQL, or market-qualified lead, is a potential customer that the marketing team wants to pass on to the sales team as a lead. The metric for this would just be the total number of MQLs you get in any given period.
An SQL, or sales-qualified lead, is then a potential customer who has been vetted by the sales team and is ready to be led through the rest of the sales process. You would calculate this the same as above.
8. Onboarding data
There are many different metrics you can use to measure the onboarding process. For example, the time it takes to complete customer onboarding, customer response rate, customer engagement rate, and so on.
9. Feature adoption
Again, there are many different metrics you can use to measure the feature adoption process. For example, the time it takes to adopt the feature, feature exposure, depth of adoption, duration of adoption, and so on.
10. Churn rates
A churn rate shows how many customers leave your business in any given period. You calculate this by dividing the churned (left) customers by the number of total customers you have.
Churn rate = churn customer / total customers
Leading vs lagging indicators in product marketing
Here's a question that might sound basic, yet trips up even experienced product marketers: Are you measuring what already happened, or what's about to happen?
Lagging indicators tell you what has already happened. They're your rearview mirror:
- "How many MQLs did we have last quarter?"
- "What was our win rate in Q3?"
- "How many customers churned last month?"
These metrics are definitive and easy to measure, but by definition, you can't change them. They're history.
Leading indicators predict what's coming. They're your windshield:
- "How many emails did we send out each week?"
- "What's our current pipeline coverage ratio?"
- "How many users completed onboarding this week?"
The magic happens when you connect leading and lagging indicators. If you know that sending 1,000 targeted emails (leading) typically generates 50 MQLs (lagging), you can predict and influence outcomes. Miss your email target this week? You'll likely miss your MQL target next month.
Here's how to build a balanced dashboard according to Larry Goldman, Director of Product Marketing at Progress:
- Start with your lagging indicators (your business goals)
- Work backward to identify leading indicators that influence them
- Set targets for both, but focus daily efforts on leading metrics
- Review the correlation quarterly to refine your predictions
For example, if customer retention is your lagging indicator, your leading indicators might include:
- Feature adoption rates in the first 30 days
- Support ticket resolution time
- Monthly active user trends
- NPS scores from recent cohorts
The trap many product marketers fall into? Building dashboards full of lagging indicators that make great quarterly reports but offer zero actionable insights for tomorrow.
Instead, aim for a 60/40 split: 60% leading indicators you can influence today, 40% lagging indicators that confirm you're on track. This balance keeps you both proactive and accountable.
Remember: lagging indicators tell you if you won the game. Leading indicators help you win it.
Advanced analytics: Multi-touch attribution for product marketing
Here's a question every product marketer faces: When a deal closes after touching seven different campaigns, who gets the credit?
If you're struggling with this, you're not alone. Attribution remains one of the trickiest challenges in product marketing measurement. But as Piper Stull-Lane, Director of Product Marketing at BioRender, discovered, the key isn't finding the perfect attribution model; it's actually about building confidence in your measurement approach.
Understanding attribution models
Before diving into complex attribution discussions, let's clarify the options:
First-touch attribution: Credits the initial interaction
- Pros: Simple to implement, highlights awareness drivers
- Cons: Ignores nurturing efforts, undervalues sales enablement
- Best for: Top-of-funnel campaign optimization
Last-touch attribution: Credits the final interaction before conversion
- Pros: Easy to track, aligns with sales mindset
- Cons: Dismisses earlier influences, overvalues bottom-funnel tactics
- Best for: Direct response campaigns
Multi-touch attribution: Distributes credit across touchpoints
- Pros: Holistic view, recognizes full journey
- Cons: Complex implementation, requires robust tracking
- Best for: Sophisticated marketing operations
Making attribution actionable
Piper Stull-Lane shared her practical approach:
"I always like to AB test on cost per lead so that I can confidently tell my boss or my boss's boss, yes, this messaging is working."
This highlights a crucial point: Attribution isn't just about credit. It's about building confidence in your decisions.
Here's Piper's framework:
- Start with clear hypotheses: Before launching, document what you expect each channel to contribute
- Test messaging systematically: Use AB testing to isolate variables
- Track cost efficiency: Monitor cost per lead across channels
- Report with confidence: Use data to avoid endless feedback rounds
The evergreen advantage
One often-overlooked aspect of attribution is campaign longevity. As Piper notes, "After working for an event tech company, I recognized that after a live event, you can still generate pipeline for months, years with on-demand programming."
This insight transforms how we think about attribution:
- Immediate impact: First 30 days post-launch
- Extended value: 3-6 months of continued engagement
- Evergreen potential: Ongoing pipeline generation
If you're able to create a launch moment that is evergreen, you can promote it, target it, tweak it, make it interesting forever.
Building your attribution strategy
Start simple: You don't need perfect multi-touch attribution on day one
- Pick one primary KPI per campaign
- Choose an attribution model that matches your sales cycle
- Document your methodology clearly
- Stick with it for at least two quarters
Layer in complexity: As your measurement matures
- Add view-through attribution for display campaigns
- Implement weighted multi-touch for longer sales cycles
- Create custom models for different product lines
- Build attribution into your campaign planning
Focus on insights: Attribution should drive decisions
- Which channels drive the most efficient pipeline?
- What content resonates at each stage?
- Where should you increase or decrease investment?
- How do channels work together?
Common attribution pitfalls to avoid
- Changing models mid-campaign: Stick with your chosen approach
- Over-attributing to easy-to-track channels: Don't let measurement capability drive strategy
- Ignoring assisted conversions: Some channels prime the pump without closing
- Focusing only on marketing touches: Sales interactions matter too
Tools and technology considerations
While perfect attribution remains elusive, modern tools can help:
- Marketing automation platforms: Track engagement across touchpoints
- CRM integration: Connect marketing activities to revenue
- Business intelligence tools: Visualize attribution paths
- Custom tracking: Build what you can't buy
The goal shouldn't be attribution perfection, but rather attribution confidence. Start where you are, test systematically, and use data to tell a compelling story about your marketing impact.
The best attribution model is the one that helps you make better decisions tomorrow than you made today.
Want to learn more?
Needing to measure your product marketing success is a huge part of the role. After all, how are you going to identify what works and what doesn’t without metrics and data to back it up?
Our Metrics Certified: Masters course will give you the knowledge and confidence you need to measure the impact of your work and continue driving, not just your product and department, but the entire company towards success.
By the end of this course, you’ll be able to:
🎆 Use formulas to correctly measure key metrics.
💪 Identify which metrics you should track for each deliverable.
👀 Understand how your work can positively influence these metrics.
🔦 Relate your KPIs to your OKRs and confidently report on the impact your function has on the business.
Ready to get started?




 Follow us on LinkedIn


.svg?v=4dc69c0c6c)